 ReelAtlas
Guides
20 hits in 100 trials | How to read a confidence interval
The Wilson interval for 20 events in 100 trials, with the full calculation, an interpretation of 95% and the method’s limits.
On this page
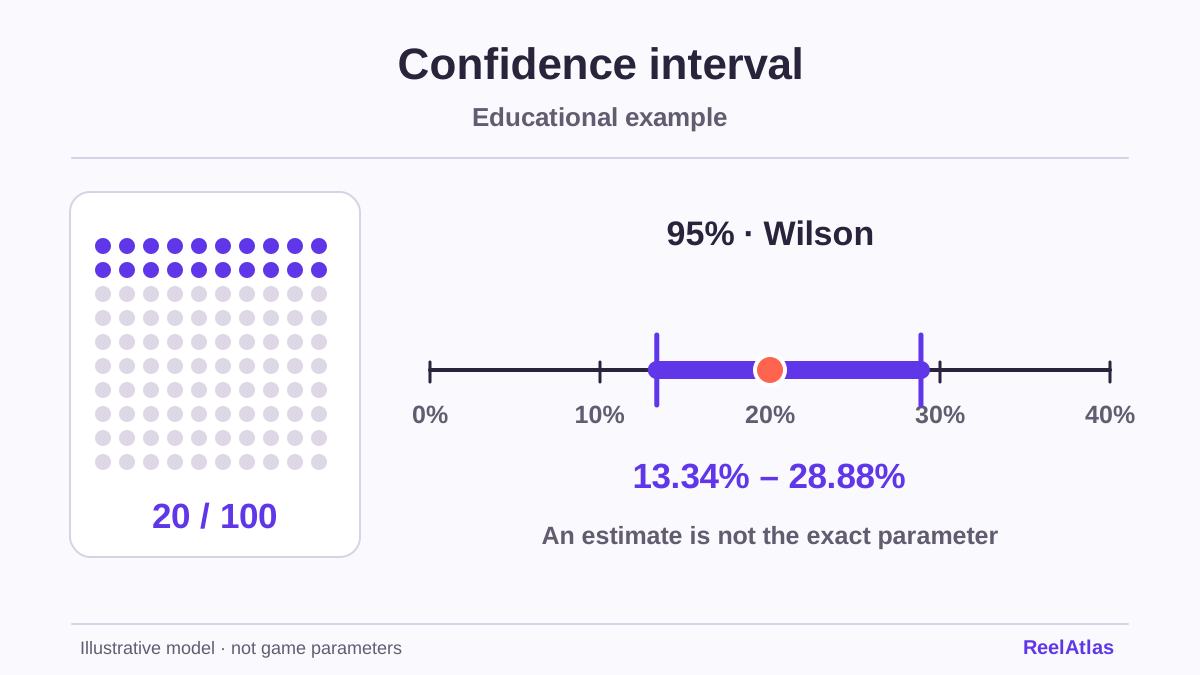
Twenty observed events in a hundred trials give a frequency of 20%. That describes the recorded sample exactly and need not be the exact probability in the model. A confidence interval helps show the uncertainty in the estimate when the assumptions are clear.
Define the event first
Consider independent draws of tokens from a bag, with replacement. The bag’s composition stays fixed, and we do not know its proportion of marked tokens. The invented sample contains 100 draws with 20 marked results. Each trial has two possible outcomes: the event occurred or it did not.
Analysing a game record would require an equally precise definition. A positive return, a return above cost and a feature trigger are different events. Keep the same definition throughout the calculation. This example establishes no parameters for any slot.
Calculate the Wilson interval
With sample proportion p̂ = 0.20, trial count n = 100 and a 95% confidence level, use z = 1.96. The Wilson formula uses the denominator d = 1 + z²/n. The centre is (p̂ + z²/(2n)) / d. The half-width is z × √(p̂ × (1 − p̂)/n + z²/(4n²)) / d.
Substitution gives a centre of about 0.2111 and a half-width of about 0.0777. The bounds are about 0.1334 and 0.2888, or 13.34% to 28.88%. Saying “the chance is 20%” leaves out this information if it fails to say that the percentage is a sample estimate.
The NIST handbook describes the method and formula. The Wilson interval differs from a simple symmetric interval formed by adding and subtracting a margin calculated solely from p̂. Its centre therefore need not be exactly 20%.[2]
What the 95% level refers to
The interpretation concerns a procedure repeated on many new samples. Under suitable assumptions, intervals from this method cover the fixed parameter in approximately 95% of repetitions. This does not mean that 95% of future individual results fall between 13.34% and 28.88%. An individual draw in this model is recorded as either zero or one.
The interval gives no guarantee about the next hundred trials. The next sample may show a different frequency. The confidence level makes no promise about any one study, and the method’s approximate coverage depends on the model and sample size.
When a calculation gives false confidence
An interval cannot fix the selection of only interesting video clips, correct for unknown configuration changes or automatically account for dependence between stages of the same feature. Before applying it, consider whether the observations can be treated as independent trials with a common probability.
Report the event definition, numerator of 20, denominator of 100, Wilson method, 95% level and limitations of the data. This is more useful than the percentage alone. When basic assumptions are missing, leave the parameter undetermined rather than adding decimal places.