 ReelAtlas
Guides
RTP and hit frequency measure different things
Two games with 96% RTP can have very different outcomes. Work out hits, returns and net results in an explicit model.
On this page
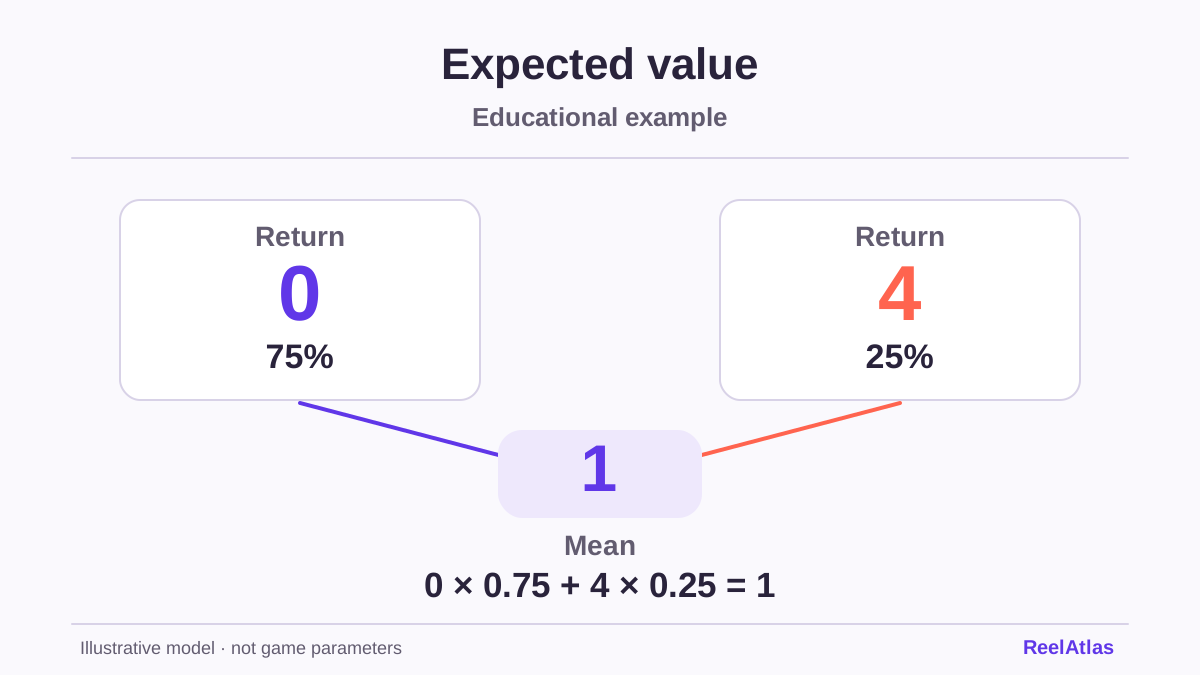
RTP concerns the average ratio of returns to stakes. Hit frequency measures how often the event defined as a hit occurs. If any positive payout counts as a hit, the measure includes payouts below the cost of the round.
Two models with the same mean
Set the cost of a trial at one unit. Model A pays 1.20 units with an 80% probability and zero otherwise. Model B pays 9.60 units with a 10% probability and zero otherwise. These are invented distributions for learning, with no link to a particular slot.
- Model A: 0.80 × 1.20 + 0.20 × 0 = 0.96 units of average return.
- Model B: 0.10 × 9.60 + 0.90 × 0 = 0.96 units of average return.
Both models have 96% RTP. A positive payout occurs in 80% of trials in A and 10% in B. The average alone does not reveal that difference. Positive outcomes are smaller in A and rarer and larger in B.
A hit can still reduce the balance
Now consider Model C. It pays 0.50 units in 80% of trials, 5.60 in 10% and zero in the other 10%. The mean is still 0.80 × 0.50 + 0.10 × 5.60 = 0.96 units. A positive return occurs in 90% of trials. A return above the one-unit cost occurs in only 10%.
Compare like definitions
Before comparing two measures, check what counted as a hit. Was it any return, a return above cost, a feature trigger or a particular symbol? Check whether the count covers paid rounds, individual cascades or spins within a feature.
A rate without a denominator is incomplete. “25%” does not tell you whether there were 25 positive returns in 100 paid rounds or 25 matches in 100 visible stages.
Why a sample is different from a game parameter
You can calculate a sample frequency from the outcomes you observed. Ten hits in forty trials gives 25%. That observation does not establish that the theoretical parameter is exactly 25%. A binomial distribution describes how an event count varies for a fixed probability under the appropriate assumptions.[1]
Avoid filling a data gap with a sequence from a video. It might omit rounds, mix modes or show selected outcomes. ReelAtlas leaves out hit frequency when the definition and configuration are undocumented.
What the example shows
A comparison needs at least the mean, how outcomes are distributed and the definition of a hit. The spread lab illustrates the first two with explicit models. None of these measures determines the outcome of the next trial.
Sources
- NIST: binomial distributionChecked