 ReelAtlas
Guides
Maximum win and RTP | Same ceiling, different outcomes
Two simple models show why a maximum return does not determine the mean or how often large outcomes occur.
On this page
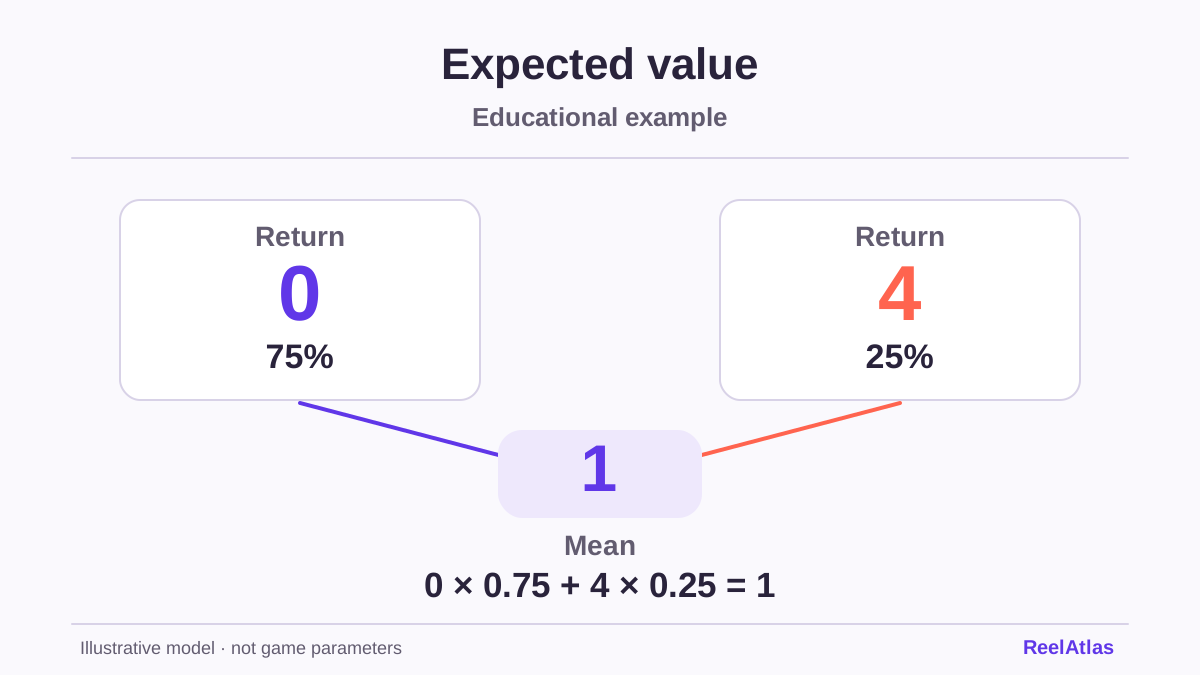
If the rules define it that way, 100x describes the upper limit on a return. It gives no probability of reaching that limit. To see the difference, consider two fictional models. They represent no particular slot, and all their assumptions are explicit.
Model A | Zero or one hundred
One trial costs 1 unit. The return is 100 with a 1% probability and zero with a 99% probability. The probabilities sum to 100%. The expected return is 100 × 0.01 + 0 × 0.99 = 1 unit, giving a theoretical return-to-cost ratio of 100%.
The maximum is 100, but the probability of a positive return is only 1%. That does not mean every block of a hundred trials contains one success. A distribution gives no schedule for events. Even with a mean equal to the cost, a short run can be very uneven.
Model B | Same ceiling, different distribution
The cost is still 1. There are three returns: 100 with a 0.1% probability, 1 with an 80% probability and zero with a 19.9% probability. They again sum to 100%. The mean is 100 × 0.001 + 1 × 0.8 = 0.9 units, or 90% of the cost.
The maximum stayed the same. Its probability, the mean and the frequency of positive returns changed. A positive return occurs 80.1% of the time, but only a return of 100 gives a positive result after cost. A return of 1 covers the cost, leaving a net result of zero. That is why a hit needs a definition.
Four numbers answer four questions
- Maximum: How high an outcome does the model allow?
- RTP: What is the expected return relative to the cost?
- Hit frequency: How often does a clearly defined event occur?
- Volatility: How widely do outcomes spread around the mean?
The maximum alone cannot recover the full distribution. Even adding RTP usually leaves many possibilities. Calculating a specific chance requires the relevant model probability or data from which it can be estimated cautiously. A promotional multiplier cannot supply that information.
Read what the limit covers
Check the actual rules to see whether the limit applies to one settlement, the whole round, a bonus or a particular feature. Is it expressed as an amount or a stake multiple? Does reaching it end any remaining stages? The answers depend on the specific document.
Keep the largest symbol multiplier separate from the maximum return for the whole game. A multiplier may apply only to part of the result or have a separate limit. The order of calculation matters.
What to record for a comparison
Record the full title, version, unit, scope of the maximum and source. If the frequency of the maximum is unknown, mark it “undetermined” rather than inferring it from RTP. The spread lab shows how a change in distribution can affect a run. The histogram guide shows how to display observed values without treating the largest as typical.