 ReelAtlas
Mechanics
Slot variability: what the average hides
Variance, standard deviation and two distributions with the same RTP, with calculations shown.
On this page
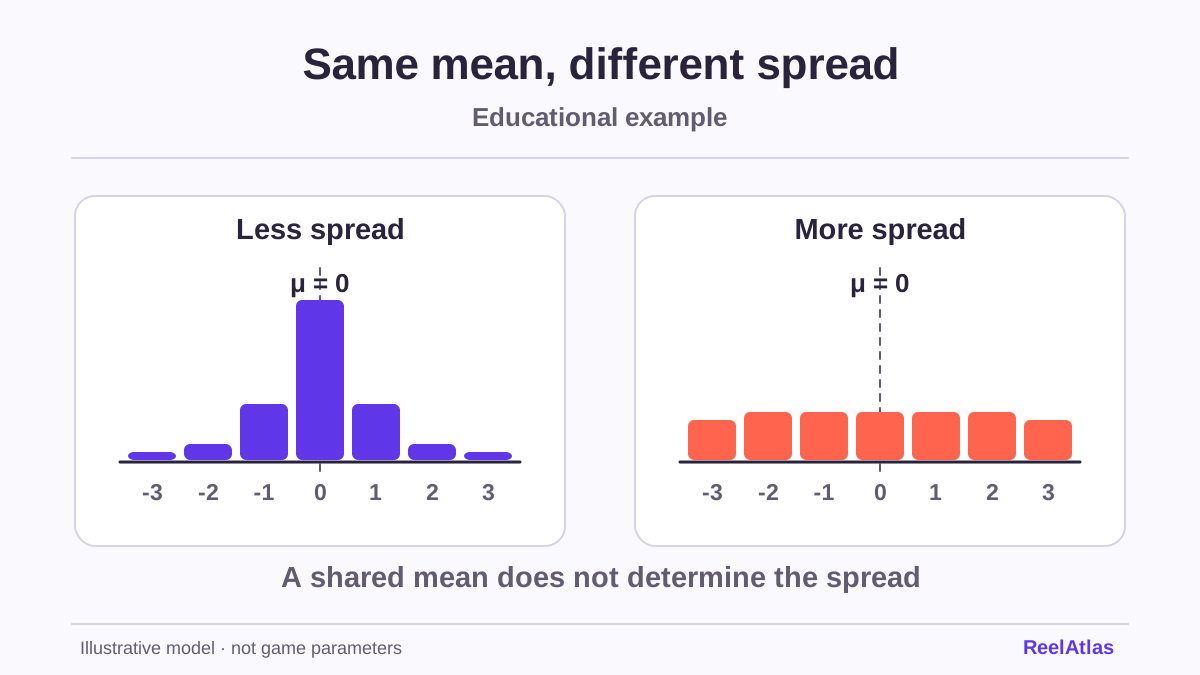
Variability describes how widely results are spread. Two models can have the same average even if one returns smaller values frequently and the other returns larger values much less often. A high-variability label cannot specify a complete probability distribution.
Two distributions with an average of 0.96
Model A returns 1.20 with an 80% probability and otherwise zero. Model B returns 9.60 with a 10% probability and otherwise zero. Each trial costs one unit. Both models have an average return of 0.96.
Variance equals the mean of squared values minus the square of the mean. For A, 0.80 × 1.20² − 0.96² = 0.2304. For B, 0.10 × 9.60² − 0.96² = 8.2944. Their standard deviations, the square roots of the variances, are 0.48 and 2.88 units respectively.
What standard deviation adds
The average is 0.96 in both models, but the second model has six times the standard deviation. The measure describes the distribution’s spread. It supplies no guaranteed range for the next result. Model B can return only 0 or 9.60, so the average itself cannot occur as a single result.
Average and typical result
In model B, zero occurs in 90% of trials. The median is zero and the mean is 0.96. Rare larger values raise the mean. An average payout can be misleading if the measure used is unclear.
NIST presents different families of distributions and their properties. That approach helps distinguish the mean, spread and shape of data. A marketing label alone cannot identify a game’s distribution.[1]
What a studio’s rating cannot tell you
Low, medium and high can be a studio’s own labels. Without a common methodology, there is no universal percentage to convert them to. Those labels cannot tell you how often a feature occurs or what amount is needed to reach a particular result.
- Record the exact rating and its source.
- Separate the studio’s description from your own calculation.
- Compare figures only when their definitions and configurations align.
The spread lab shows how changing the distribution affects model results. The accompanying guide on hit frequency explains why frequent positive returns need not mean frequent increases in the balance.