 ReelAtlas
Guides
Why a video of wins is not a statistical sample
How selecting striking scenes changes the mean and hit frequency. A worked example using a full log and an excerpt.
On this page
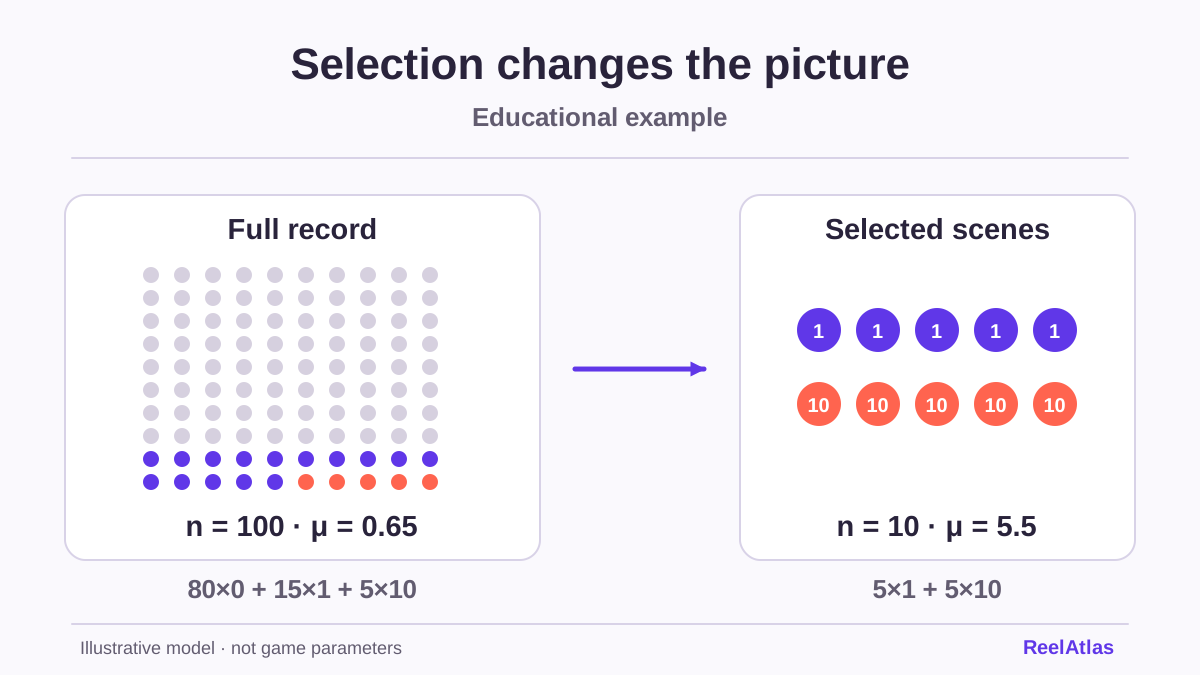
A compilation of ten striking moments can portray each one faithfully while giving a misleading impression of the whole. The problem starts with how observations were selected. Before calculating a hit rate from a video, establish which events could have made it into the recording.
One log, two stories
Imagine a complete, synthetic log of 100 trials. Eighty outcomes are 0, fifteen are 1 and five are 10. Total returns are 65 units. The mean across all observations is 0.65, and 20% of entries show a positive outcome. These are practice data, with no measurements from a commercial game.
Now take all five tens and five of the ones from that log. The edit contains ten scenes, all with positive outcomes. The mean of those ten selections is 55 / 10 = 5.5. The numbers stayed the same. Changing the selection rule produced a very different description.
“All the outcomes shown were positive” remains true. “The outcome is always positive” goes beyond the footage. That jump from describing an excerpt to making a claim about the whole is the problem.
More scenes do not fix poor selection
If the collection includes only outcomes that meet a threshold, gathering a thousand such scenes still describes outcomes selected using that threshold. A large sample does not undo the systematic omission of other events. Similarly, a survey open only to people who want to show off their results does not become a random sample of all participants.
OpenIntro distinguishes random selection, convenience samples and nonresponse problems. Here that means asking where the recordings come from, who submits them and what stays off screen. The point is independent of the video maker’s intentions. Even a properly labelled compilation has a limited scope.[1]
Four questions for reviewing the footage
- What is the unit of observation? A paid round, one stage of a cascade or a whole feature?
- Does the recording cover every unit in the specified period, including zeros?
- Was the selection rule set before viewing the outcomes?
- Can you reconstruct the observation count and total costs and returns?
If the video only shows the final result, the distribution of the steps leading to it remains unknown. If it combines modes, a single frequency can mix different situations. When the same clip appears in multiple compilations, those appearances do not count as independent observations.
What the footage can support
Footage can still help describe an animation, a symbol’s appearance or the visible course of a feature. Keep the conclusion within that scope. Selected scenes cannot establish RTP or the frequency of events in the full population.
For a statistical exercise, an existing complete dataset or an educational model with visible assumptions is enough. You can obtain data for analysis without playing for money. Our labs show their assumptions directly. The demo guide also helps establish whether two recordings show the same product and mode.