 ReelAtlas
Guides
Monte Carlo simulation and exact expected value
A two-outcome model with explicit assumptions, an exact mean and simulation error. What to record to reproduce the calculations.
On this page
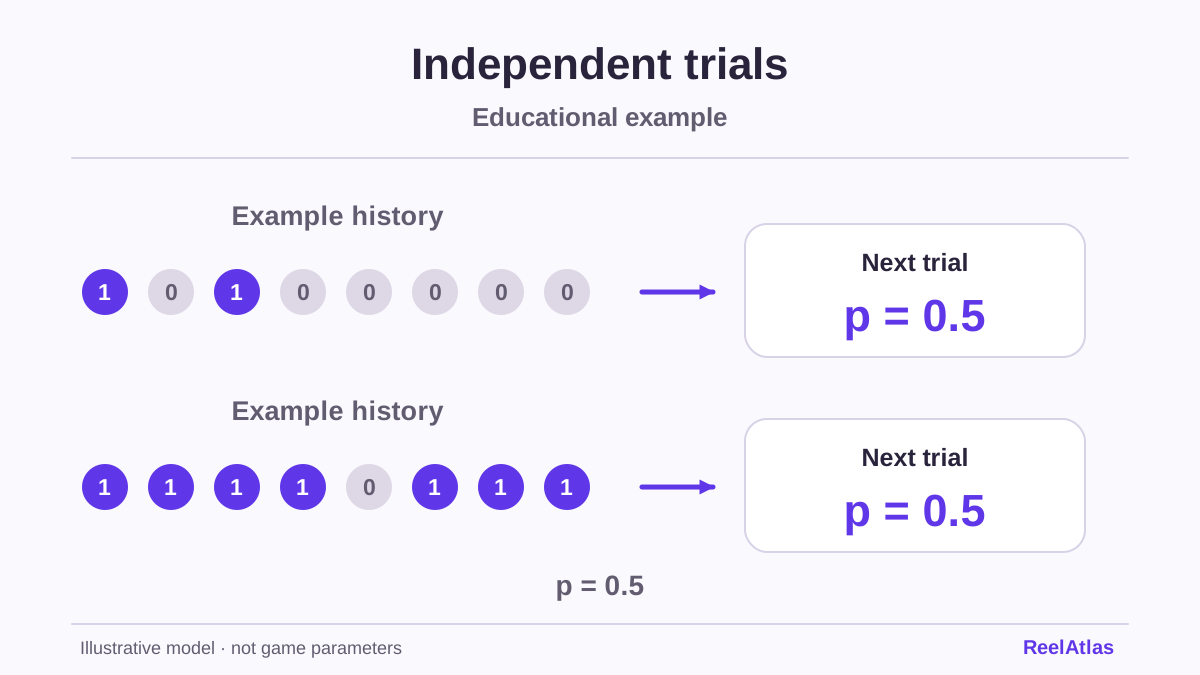
A computer can generate thousands of outcomes per second, but the number of draws alone does not establish that the model is sound. A Monte Carlo simulation repeats a process with specified rules and summarises the outcomes. Its value depends on whether those rules fit the question we are trying to answer.
A model you can calculate on paper
Suppose a trial returns 0 with a 75% probability or 4 with a 25% probability. Each trial costs one unit. Outcomes are independent and the probabilities stay fixed. This is a complete synthetic model for learning.
The exact expected return is 0 × 0.75 + 4 × 0.25 = 1. After deducting the unit cost, the expected net result is 0. We can obtain both numbers without simulation by adding the contributions of the distribution’s two branches directly.
Why a run can produce a different mean
Suppose an example record of 100 trials contains 22 occurrences of 4. The total return is 88 and the sample mean is 0.88. The difference from the exact mean of 1 is consistent with sampling variability. It does not demonstrate an error in the formula. The count of 22 is hypothetical and did not come from a run of an experiment.
The variance of a single return is 0.75 × 0² + 0.25 × 4² − 1² = 3. For n independent trials, the standard error of the mean is √(3/n). It is about 0.173 for 100 trials and 0.0173 for 10,000. Increasing the trial count a hundredfold reduces this measure of uncertainty by a factor of ten.
This relationship describes the spread of sample means when an experiment is repeated. It does not require every longer run to end up closer to the target than every shorter one. An individual run can still move farther from the expected value for a while.
What to record so the result can be reproduced
- The full list of values and their probabilities, which sum to 1.
- The number of trials and the independence rule or a description of any dependence.
- The generator, its version and its seed, if the tool provides them.
- The definition of the quantity reported, such as return, net result, mean or frequency.
The seed alone is insufficient if the algorithm or the order in which numbers are drawn changes. The same seed helps reproduce a run in the same environment. It does not improve how the model describes an actual game.
More draws cannot uncover missing rules
If the model omits an extra feature or uses incorrect probabilities, a million trials will describe that flawed model more precisely. Simulation cannot recover a commercial product’s hidden tables from its name, artwork or stated RTP.
Our expected value lab lets you check the arithmetic for explicit branches first. The spread lab illustrates the difference between an average and individual outcomes. Use the tools to explore assumptions and uncertainty. No run indicates when the next round of a particular game will yield a particular result.